
Calculating Mortality from COVID-19
Executive Summary
Sub-groups within a patient cohort may be at higher risk of mortality, due to factors such as pre-existing conditions.
The “raw” number of deaths within a sub-group does not tell the full story, as there may be hidden correlations between features of the sub-group and the disease under study.
For example, age is a factor in both mortality from COVID-19 and pre-existing dementia. “Raw” analysis may erroneously conclude that dementia is a risk factor for mortality from COVID-19.
A more robust mortality rate is found by weighting patients according to demographic profile.
This allows for clearer comparison of potential risk factors, ultimately revealing true correlations between sub-groups and outcomes.
The problem
Recently, BioSymetrics had a project to determine which patients are most at risk of mortality due to COVID-19. We considered a wide range of possible factors, including demographics, pre-existing conditions, symptoms, and vital signs such as pulse. The aim was to see what makes someone more susceptible to the worst outcome, in order to inform vaccination efforts.
We worked with EHR data from a population of 28,000 people given a PCR test in the New York area between February and April 2020 (the early stages of the pandemic in the United States). Of these, roughly 6,200 patients had a positive case of COVID that was resolved within the timespan of the dataset (meaning they either died, or survived and had no further contact with the medical system: people who were still in hospital were removed from this analysis). The baseline mortality rate for this COVID-positive population was a (sadly high) 15.7%.
The simple approach to investigating risk factors is to calculate the mortality rate of various sub-populations, and to compare against the baseline rate of 15.7%. If the sub-population of patients with (say) heart failure has a mortality rate higher than 15.7%, we could assume that having heart failure is a risk factor. However, this doesn’t take into account the demographics of the sub-population. We know that COVID severity is strongly influenced by the patient’s age: if the sub-group of patients with heart failure happens to be older than the general COVID-positive cohort, any increase in mortality rate could simply be due to the demographics of the patients being examined, not a real relationship with heart failure.
The solution
This is a common problem in any sort of population sampling. Election polls are often conducted by phone, which relies on people taking the call. This tends to over-sample older segments of the population and business owners, as many others let calls go to voicemail. Raw numbers of survey respondents may give a very inaccurate picture of voting intentions, simply because of this mismatch between the demographics of the poll and the demographics of the electorate.
A common method of controlling for demographics is to apply Post Hoc Stratified Re-Weighting, which assigns a weight to each member of the sub-population in order to more closely match their prevalence in the background population. It’s “post hoc”, because it’s applied after the data has been collected, and the full extent of the mismatch between the sub-group and the background population can be calculated. It’s “stratified” because the population is split into demographic strata, such as Asian men born in the 1950s, or White women born in the 1980s. “Re-weighting” means that instead of each respondent contributing 1 vote to the survey, their vote is weighted up or down according to the demographic stratum they belong to.
In the electoral example, younger respondents who don’t own a business will tend to be undersampled, and their response will therefore be given a weighting higher than 1. The aim is to set the weights of the sample so that voting intention is captured as if the full electorate had been surveyed.
How does this apply to COVID-19?
We built our population strata on the demographic dimensions that had most effect on patient mortality:
Race: one of Asian, Black or African American, Hispanic, Other, White, or Unknown
Sex: one of Male, Female, or Other
Age decade: under 1 year old, 1 to 10, 11 to 20, 21 to 30, …, 81 to 90, and over 90
COVID severity: Severe, Moderate, Mild, Other/Asymptomatic.
This gave 369 different strata in the baseline population, the most prevalent of which was <Black or African American, Male, 61 to 70, Severe> at 2.32% of the population.
The baseline percentages of each stratum in our full population were considered the “target”, or the background distribution that we adjust each sub-group towards. It is important to note that these baseline percentages do not represent the background of the country or New York state, or even of the full hospital patient set, due to biases in who was given a PCR test during the period under study. It would be possible to apply post hoc stratified re-weighting to our population of 6,200 patients, in order to get a better representation of mortality for one of these other populations. However, the purpose here was to compare sub-groups to the baseline of our study population, and therefore we chose the distribution of that population as the target.
The results
Among the attributes examined, we looked at the effect of pre-existing conditions, and the effect of vital signs recorded at the time of the PCR test.
Pre-existing conditions
Looking at the “raw” mortality rates for a few pre-existing conditions (Figure 1), we would tend to draw the conclusion that mortality is higher for those with COPD; about the same as baseline for those with rheumatoid arthritis or paralysis; and lower for those with HIV/AIDS.

Figure 1: Raw mortality for selected pre-existing conditions
But once we apply post hoc stratified re-weighting, we can see a very different picture. Figure 2 shows for each condition the re-weighted mortality rate, and the number of people n with the condition. For those conditions where mortality is significantly different from the baseline (p<0.05, corrected for multiple hypothesis testing), we also show the p-value of the difference.

Figure 2: Mortality for pre-existing conditions adjusted by post hoc stratified re-weighting
Now, we can draw more robust conclusions:
Mortality is significantly higher than baseline for those with COPD or rheumatoid arthritis
This is particularly notable for rheumatoid arthritis, which previously appeared to be no different from baseline. Without adjusting the weights, we may have overlooked that this condition appears to be a significant risk factor.
In contrast, COPD looked to be a risk factor both in the raw data and in the adjusted mortality rate. In fact, the adjustment is so small that the demographic profile of those with COPD must match quite closely the demographic profile of the baseline population.
Mortality is not significantly different from baseline for those with HIV/AIDS or paralysis
This is particularly notable for HIV/AIDS, which previously appeared to be lower than baseline. We may have erroneously concluded that HIV/AIDS provided some protective effect against COVID-19, when this adjustment shows that the mortality rate is simply an effect of the demographic profile of those with this condition.
The significance test is very important for the case of paralysis, where the adjusted mortality rate looks quite different from the baseline. But due to the small number of patients in this sub-group (and the relatively high number of conditions we’re testing), the difference is not statistically significant.
Vital signs
Another dimension of risk is the vital signs of patients at the time of the PCR test. If the vital sign (such as temperature or O2 saturation) was taken, the patient’s health record shows the value (e.g. 37C or 98%). If the vital sign was not taken on the day of the PCR test, we used a binary flag to indicate that it was missing from the record (e.g. “Missing O2 saturation” is True if O2 saturation was not measured). This analysis considers the sub-group of patients with vital sign values in the most extreme quartile (i.e. the lowest quartile for O2 saturation, the highest quartile of temperature records).
Looking at the raw mortality data shown in Figure 3, we would conclude that patients with the lowest O2 saturation are at higher risk of mortality than baseline, while those with no recorded O2 saturation are almost certain to survive. This makes intuitive sense, as we may assume that O2 saturation was not measured for patients who appeared asymptomatic, and less-severe COVID-19 is less likely to result in mortality. In contrast to this clear relationship, we would conclude that BMI has no impact on mortality (whether recorded or not).
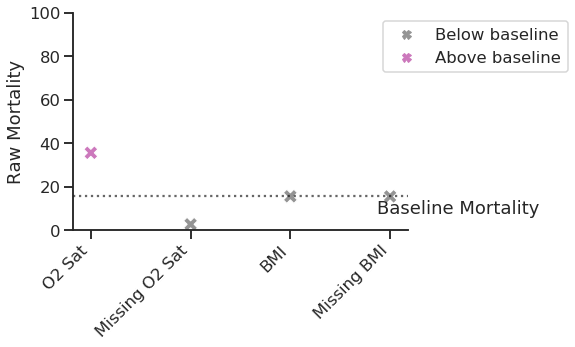
Figure 3: Raw mortality for selected vital signs
However, when adjusting mortality rates a slightly more complex picture emerges (Figure 4). BMI still appears to have no impact on mortality, as neither the top quartile of recorded BMI nor it being missing is associated with a significantly different mortality rate from the baseline. However, note that the values of n show that most patients are missing BMI. The lack of significance may be due to either it not being clinically relevant, or the smaller number of cases with recorded BMI not being enough to highlight a weak correlation.

Figure 4: Mortality for selected vital signs adjusted by post hoc stratified re-weighting
In contrast, both O2 saturation and missing O2 saturation are found to be significantly different from the baseline. However, both are corrected towards the baseline. This suggests that O2 saturation was not being measured for a subset of patients that are demographically more likely to survive, such as the young. Any patients missing O2 saturation who did not fit this demographic and did suffer mortality are up-weighted by the stratification process (in recognition of there being more people with their demographics in the baseline population), and hence the mortality rate for this sub-group increases.
We can look for confirmation in the differences of each demographic stratum between the baseline population and the subset of patients with Missing O2 Saturation (Figure 5). This figure looks at each dimension of the strata (race, gender, age, and severity), and compares the percentage of patients with each value in the baseline population with the percentage in the subset. For example, the top left plot shows that the percentage of White patients is lower in the baseline population than in the subset (25% to 34%), while the percentage of Hispanic patients is higher in the baseline (24% to 19%). In contrast, the gender percentages are consistent between the population and the subset.

Figure 5: Stratification of cohort with Missing O2 Saturation compared against full population
Indeed, this figure confirms that patients who are missing O2 saturation are:
More likely to be White and less likely to be Black or Hispanic (than the baseline population)
More likely to be aged between 21 and 50, and less likely to be 51 to 90 (than the baseline population)
More likely to be asymptomatic, and less likely to be classed as having severe COVID-19 (than the baseline population).
These demographic attributes align directly with whether someone is inherently less or more likely to suffer mortality from COVID-19. Therefore, post hoc stratified re-weighting has correctly adjusted both the O2 saturation and Missing O2 saturation subsets towards the baseline.
Conclusions
This analysis of mortality due to COVID-19 highlighted that some patients are at higher risk due to factors such as pre-existing conditions. However, the raw mortality rate for a subset of patients may hide correlations between those patients and factors known to affect COVID-19 outcomes, such as age. Post hoc stratified re-weighting is used to adjust the mortality rate of subsets, in order to make it more directly comparable against the baseline rate of mortality from the whole cohort. Here we showed how this technique can reveal risk factors that were previously hidden, and clarify that some factors seeming to influence mortality are not statistically significant.