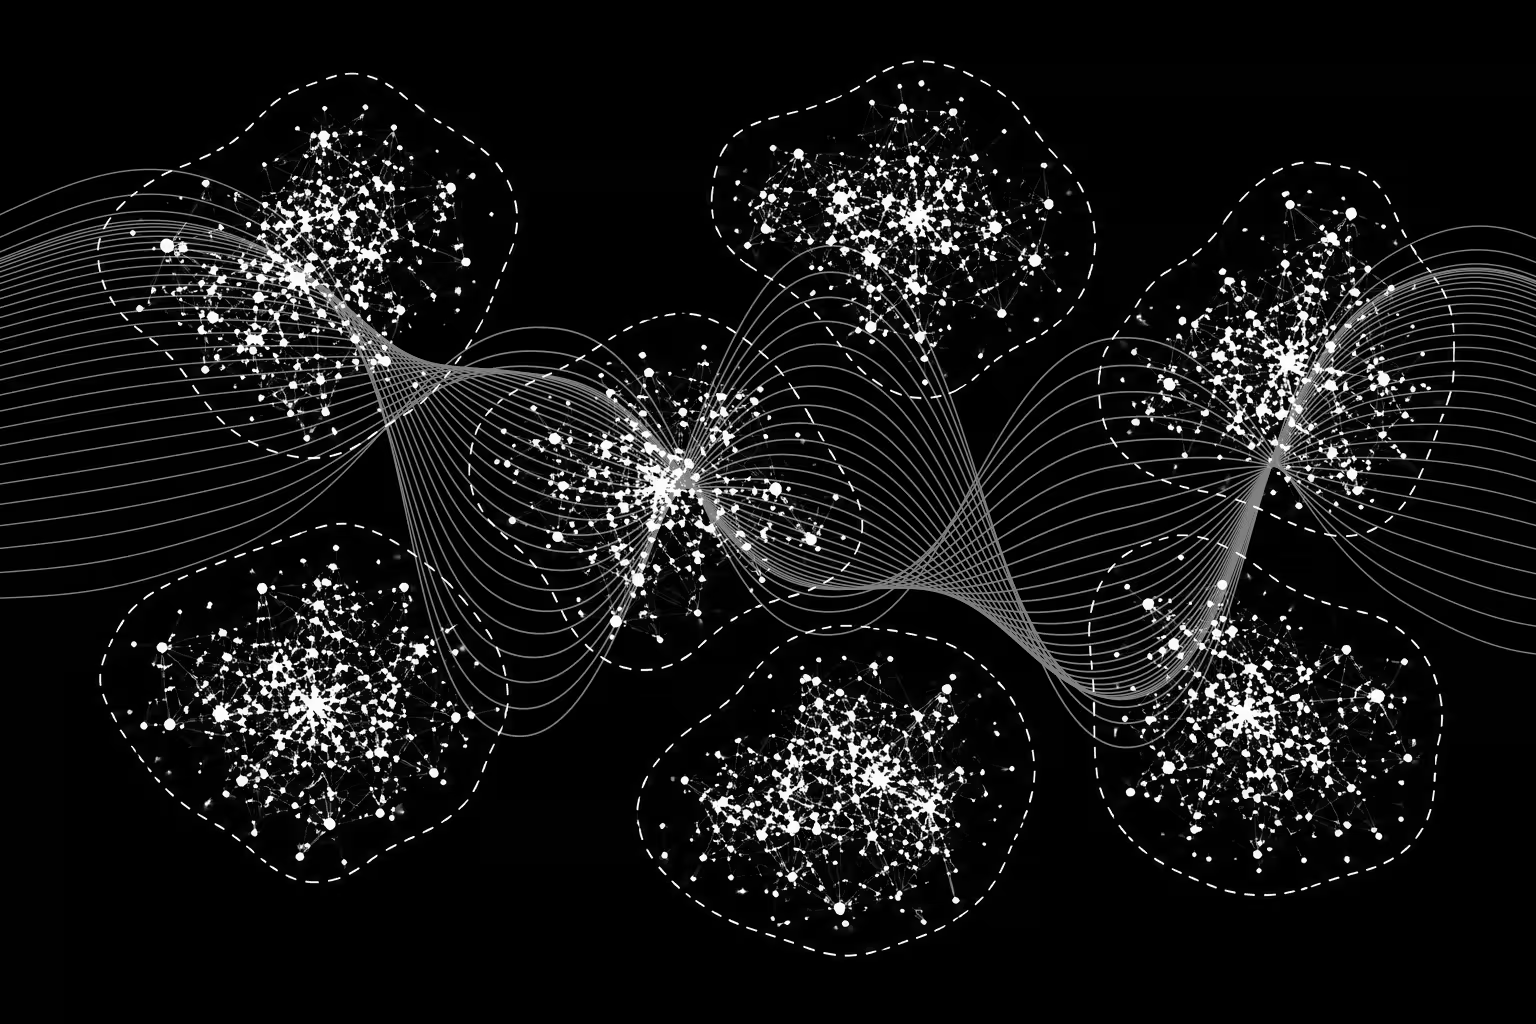
Define subgroups
Identify phenotypic groups that reflect meaningful differences in disease biology or progression.

The Phenograph™ from BioSymetrics connects human clinical phenotypes with model-system phenotypes, genes, pathways, targets, and therapies to support biomarker discovery and target prioritization.
Clinical and biological data span multiple modalities, and important gene–phenotype relationships may be missing from existing knowledge. That combination makes it harder to define meaningful subgroups, find biomarkers, and prioritize targets for action.
We integrate human clinical and model-system evidence, apply Contingent AI™ to infer gaps in known gene-phenotype associations, and map relationships across genes, phenotypes, targets, pathways, and drugs. The result is a structured set of hypotheses for downstream experimental validation.
The Phenograph™ brings together a large translational graph and a set of gene-disease prioritization prediction models.
253,000 graph nodes.
11.3 million graph edges.
329 gene-disease prioritization prediction models.
77% of the data is proprietary and AI-derived.
We help partners move from patient and model-system phenotypes to questions they can test.
Identify phenotypic groups that reflect meaningful differences in disease biology or progression.
Surface biomarkers linked to disease states, progression, or treatment response.
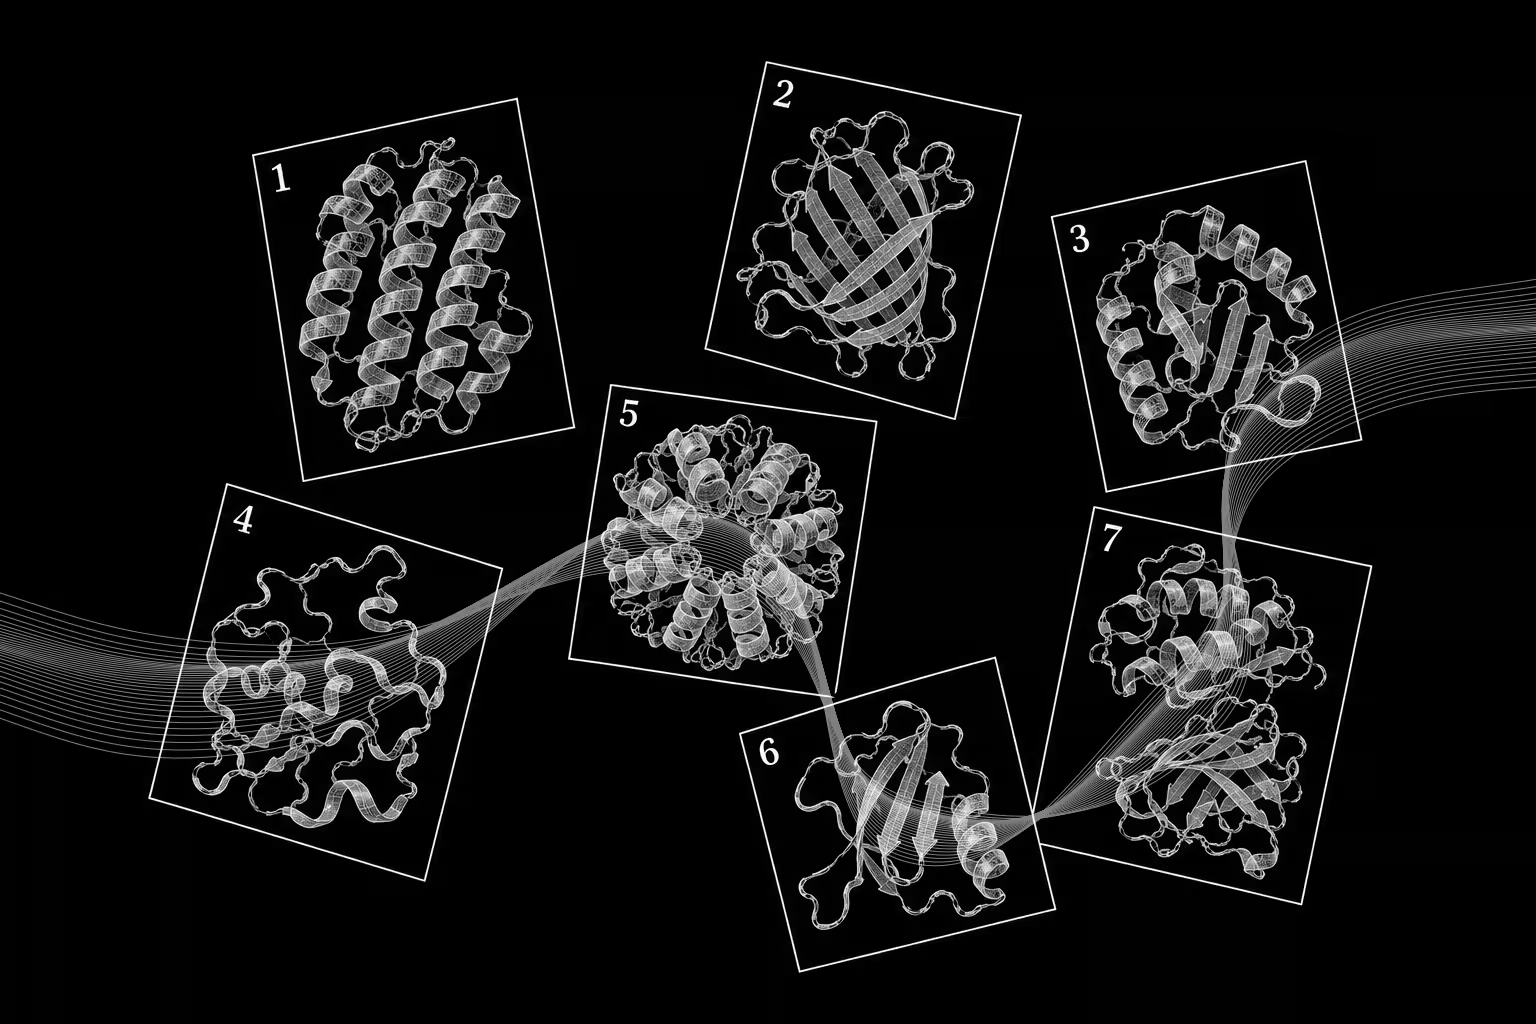
Rank genes, disease drivers, and therapeutic targets for further investigation.
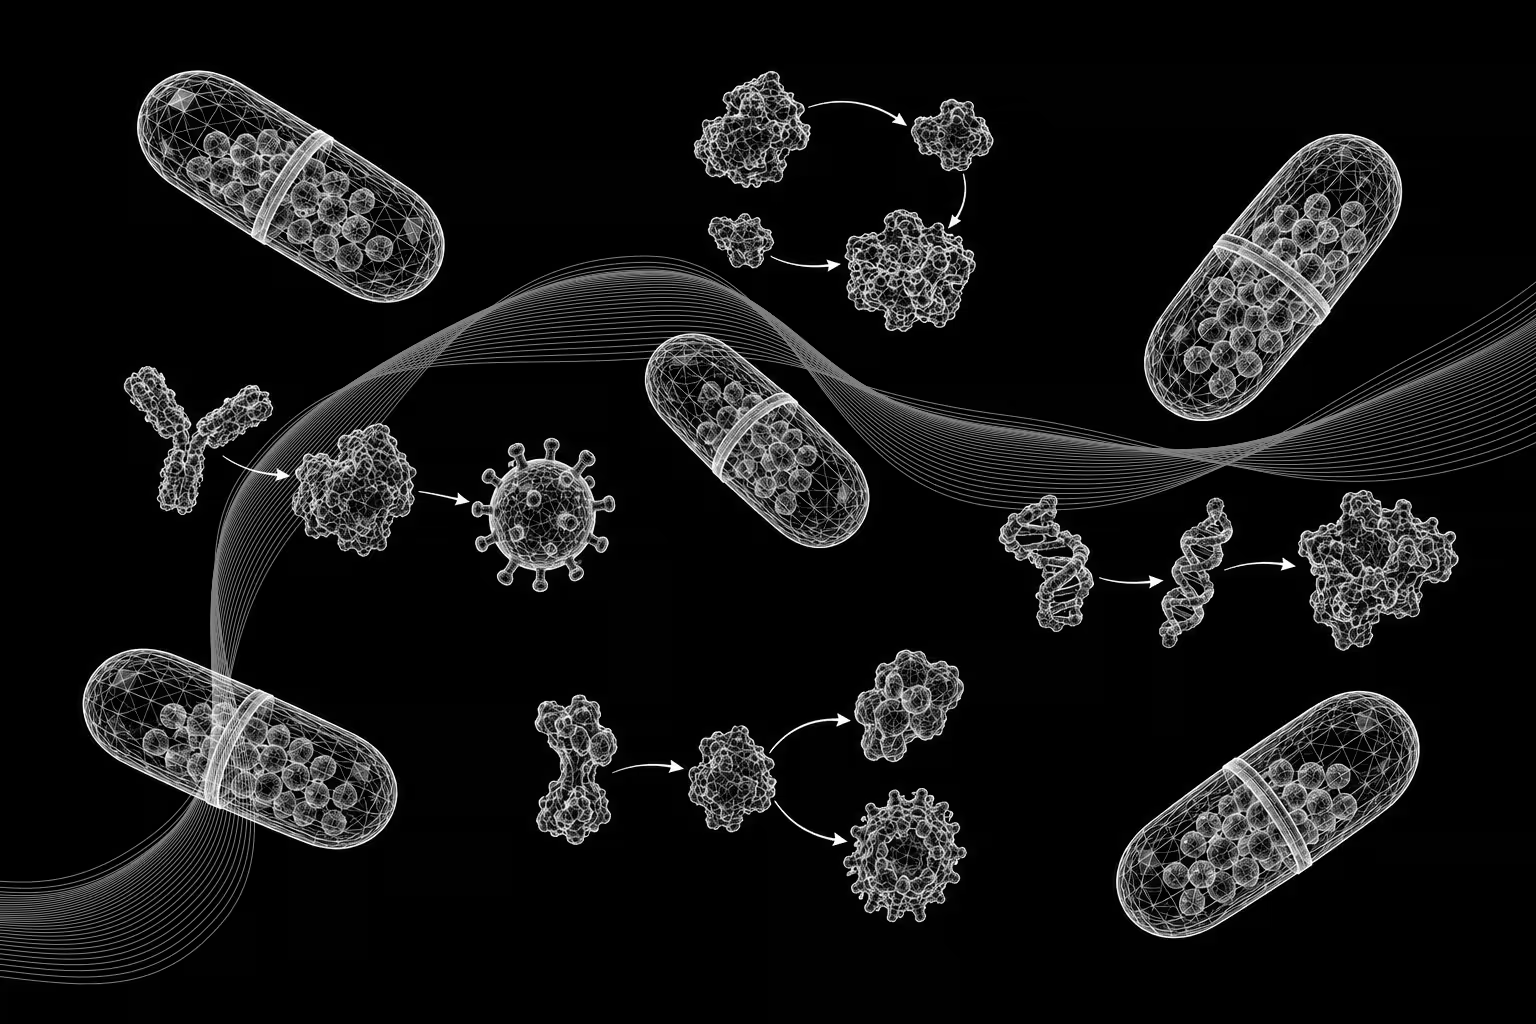
Connect findings to pathways, drugs, and validation plans.
Within our broader platform, the Phenograph™ acts as the knowledge and translation layer. We use its predictions to prioritize and guide downstream validation, connecting computational hypotheses with experimental evidence.
Talk with us about a defined disease stratification, biomarker, or target prioritization question and explore a translational validation collaboration.
Partner with us